Trend & Trendline
The trend is the predominant direction of the market over time.
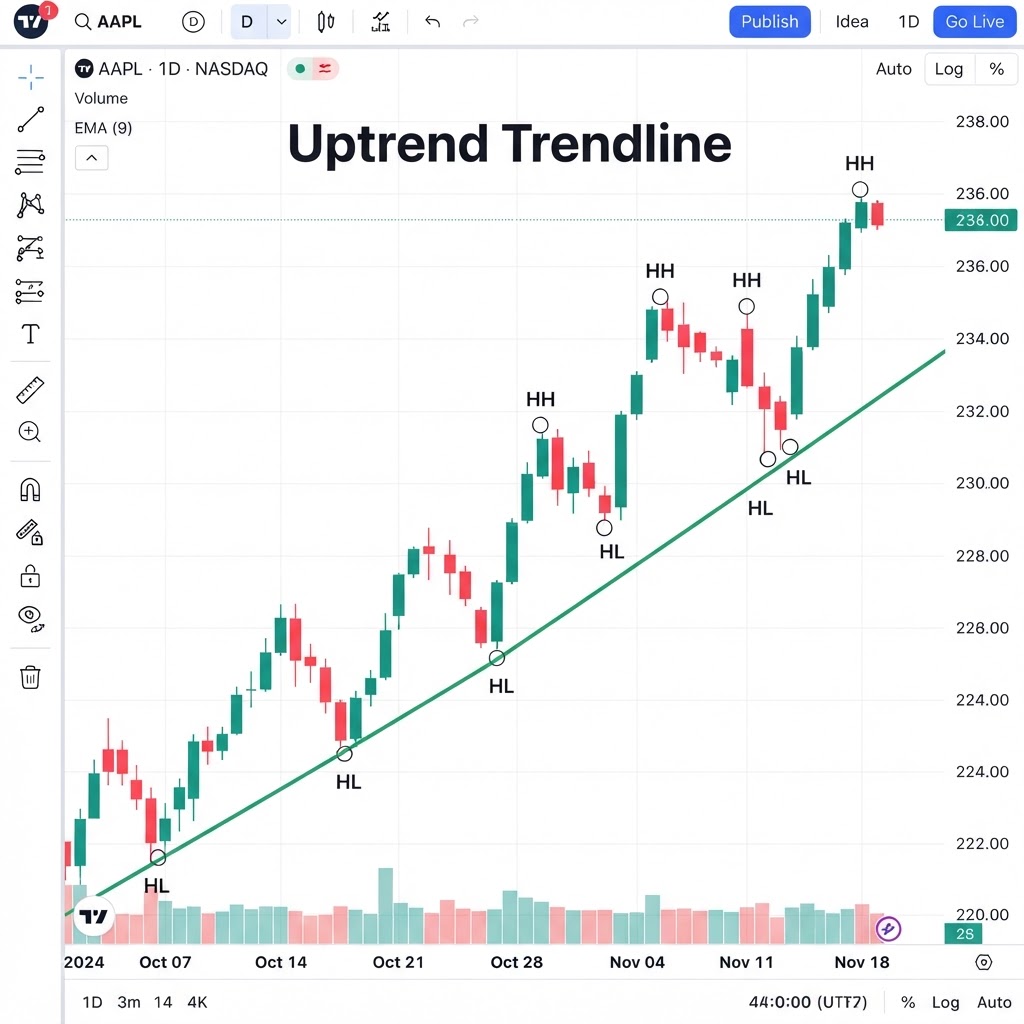
Realistic chart representation
These concepts are the foundation of all technical analysis. Mastering them is a prerequisite for any professional trading strategy.
What is the Trend & Trendline pattern?
The trend is the predominant direction of the market over time. An uptrend is characterized by progressively higher highs and lows (Higher Highs + Higher Lows). A downtrend by progressively lower highs and lows (Lower Highs + Lower Lows). A trendline is a straight line connecting significant price points to visualize and quantify the trend.
How do you trade Trend & Trendline?
Why does the Trend & Trendline pattern work?
A trend is the general direction in which a market is moving. There are three types: uptrend (higher highs and higher lows), downtrend (lower highs and lower lows), and sideways/range (no clear direction). Trendlines are diagonal lines drawn connecting consecutive highs (downtrend) or lows (uptrend) to visualize and confirm the trend.
An uptrend is defined by progressively higher highs and higher lows. Each rally exceeds the previous high, and each pullback stops above the previous low. This staircase pattern shows that buyers are in control — they're willing to pay higher prices, and each pullback attracts new buyers. A downtrend is the mirror image: progressively lower highs and lower lows, showing seller dominance.
A trendline is drawn by connecting at least two consecutive lows (in an uptrend) or highs (in a downtrend). A third touch confirms the trendline's validity. The more touches a trendline has, the more significant it is — but also the more likely it is to break (each test weakens the line). Trendlines should be drawn on the closes, not the shadows, for more accuracy — though many traders use shadows for a more conservative line.
The trend is 'your friend' — trading in the direction of the trend significantly increases the probability of success. Counter-trend trades are possible but riskier and should be taken only at major support/resistance with strong reversal signals. The trend is considered intact until a clear break of the trendline with a close (not just a shadow). A trendline break signals a potential trend change, but confirmation from subsequent price action is recommended.
Multiple timeframes should be analyzed: the trend on a higher timeframe (e.g., Daily) takes precedence over the trend on a lower timeframe (e.g., 1H). A common strategy is to trade in the direction of the Daily trend, using the 1H or 4H for entry timing.