Symmetrical Triangle
The Symmetrical Triangle is a consolidation pattern that forms when descending highs and ascending lows create two converging trendlines with similar slope.
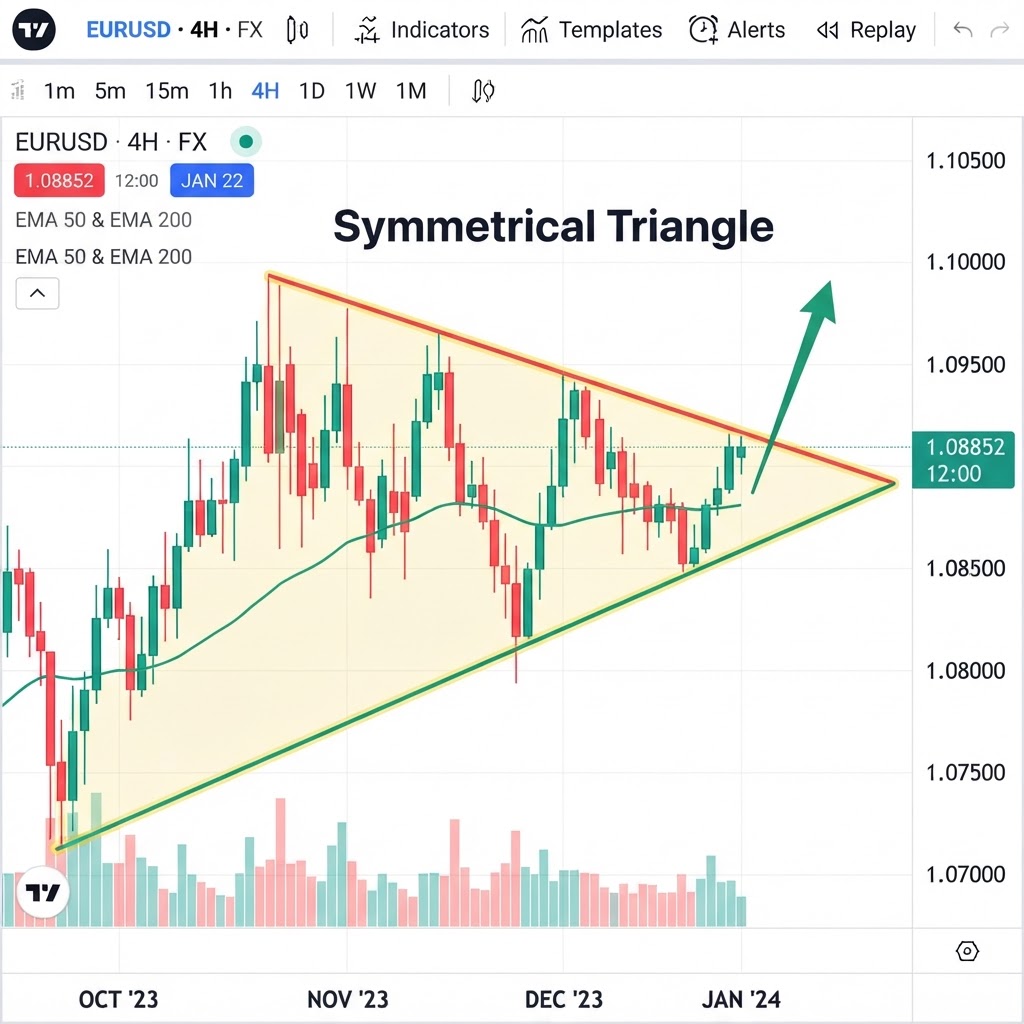
Realistic chart representation
Chart formations require multiple sessions to complete. The higher the timeframe, the more reliable the pattern. Do not anticipate: wait for breakout confirmation.
What is the Symmetrical Triangle pattern?
The Symmetrical Triangle is a consolidation pattern that forms when descending highs and ascending lows create two converging trendlines with similar slope. Price progressively compresses into an increasingly small space. It doesn't indicate the breakout direction — it can be either bullish or bearish — but signals that an explosive move is imminent.
How do you trade Symmetrical Triangle?
Why does the Symmetrical Triangle pattern work?
The Symmetrical Triangle is a continuation pattern that can break in either direction, though it typically continues the prior trend. It forms when price makes lower highs and higher lows simultaneously, creating a converging pattern that resembles a triangle. The two trendlines (descending resistance and ascending support) converge toward an apex.
The pattern represents a 'balance of power' between buyers and sellers. Sellers are pushing price down (lower highs) but losing strength with each push. Buyers are pushing price up (higher lows) but also losing strength. This progressive narrowing shows that the market is consolidating, waiting for a catalyst to decide the next direction.
The breakout direction is typically the same as the prior trend — if the triangle forms during an uptrend, the breakout is usually bullish, and vice versa. The breakout should occur between 50% and 75% of the triangle's width (measured from the base to the apex). A breakout too early (near the base) may be premature; a breakout too late (near the apex) has less power. Volume should decline during the triangle and surge on the breakout — this volume confirmation is critical for distinguishing genuine breakouts from false ones.
The projected target is the height of the triangle at its widest point (the base), measured from the breakout point in the breakout direction. Stop loss goes just outside the opposite trendline from the breakout point.