Flag
The Flag is one of the most reliable and frequent continuation patterns.
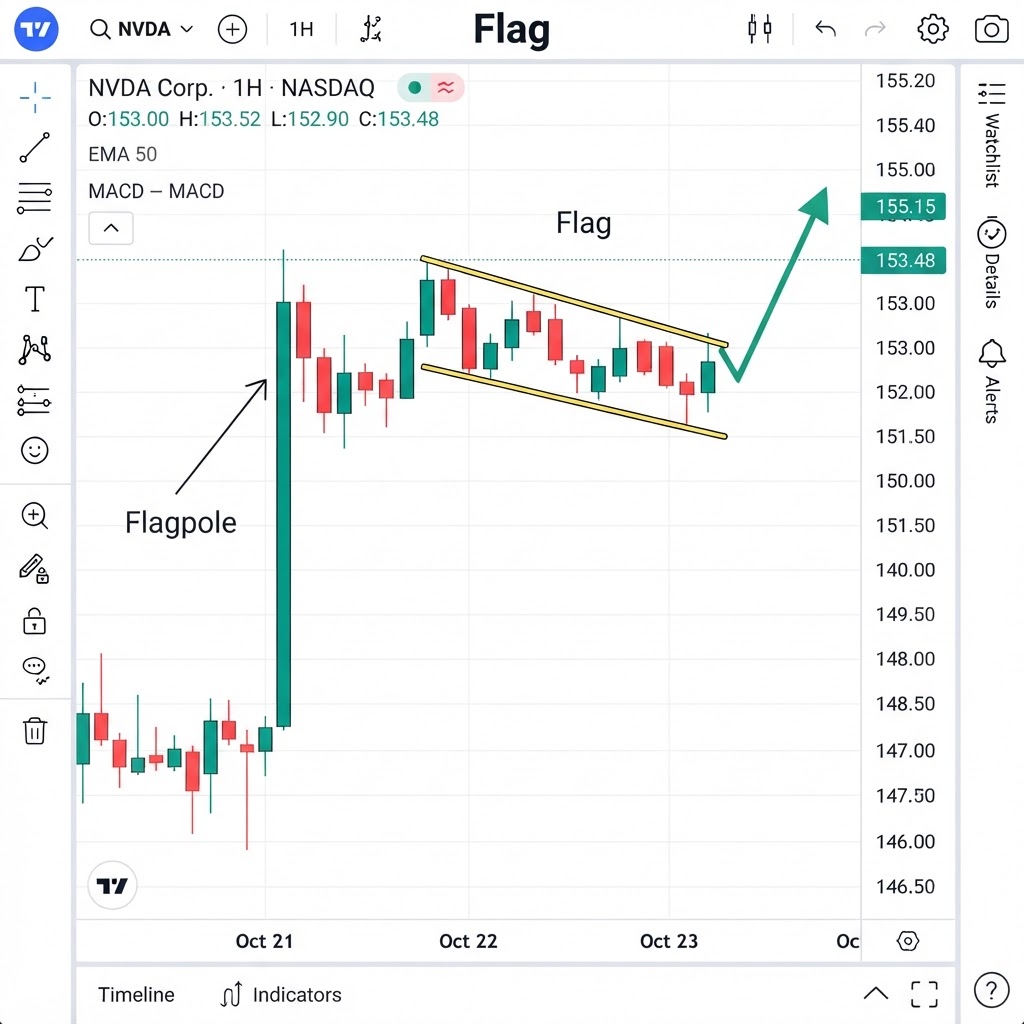
Realistic chart representation
Chart formations require multiple sessions to complete. The higher the timeframe, the more reliable the pattern. Do not anticipate: wait for breakout confirmation.
What is the Flag pattern?
The Flag is one of the most reliable and frequent continuation patterns. It forms when a strong impulsive move (the 'pole') is followed by a tight consolidation in a slightly counter-trend direction (the 'flag'). The flag itself is formed by two parallel lines slightly inclined against the trend. The breakout from the flag in the original trend direction completes the pattern.
How do you trade Flag?
Why does the Flag pattern work?
The Flag is a continuation pattern that forms after a strong directional move (the 'flagpole') and represents a brief consolidation before the trend resumes. The pattern consists of a sharp, near-vertical price move (the pole) followed by a small rectangular channel that slopes against the trend (the flag). The flag should be small relative to the pole — typically a 38.2% to 50% retracement of the pole.
The flagpole represents a burst of institutional buying (in a bullish flag) or selling (in a bearish flag) — a sudden, aggressive move that signals strong conviction. The flag represents a breather — profit-taking and counter-trend traders create a small pullback, but the overall conviction remains. When the consolidation ends, the trend resumes with a move that often equals the flagpole's height.
The key parameters are: (1) a strong, near-vertical flagpole (the sharper, the better), (2) a small, orderly flag that retraces 38-50% of the pole, (3) declining volume during the flag (consolidation), (4) a volume surge on the breakout (conviction returns). The projected target is the height of the flagpole, measured from the breakout point in the trend direction. Stop loss goes just outside the flag, on the opposite side of the breakout.
Flags are typically short-lived — they form over 1-3 weeks on Daily charts. A flag that lasts too long loses its momentum and may become a different pattern. The best flags are tight, orderly, and brief — they show controlled consolidation, not distribution.