Support & Resistance
Support and resistance are the most fundamental concepts of technical analysis.
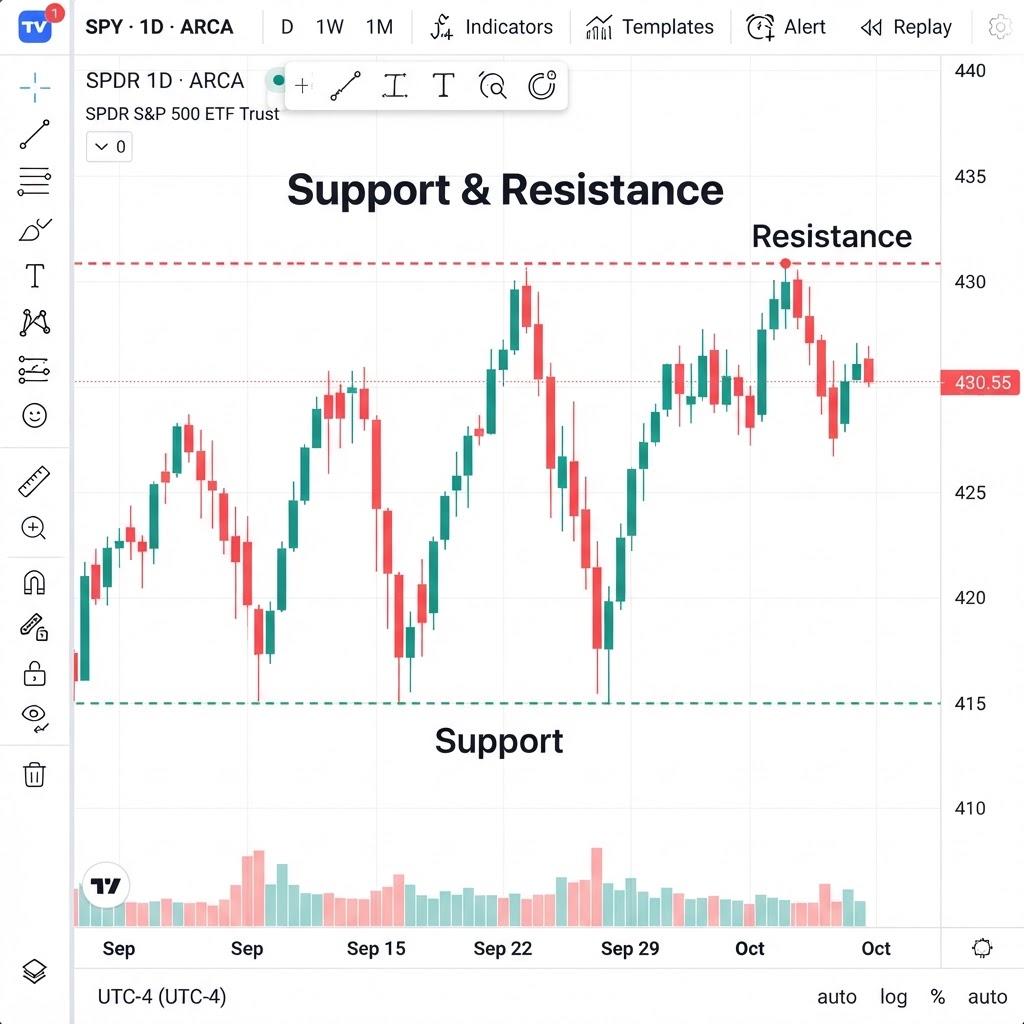
Realistic chart representation
These concepts are the foundation of all technical analysis. Mastering them is a prerequisite for any professional trading strategy.
What is the Support & Resistance pattern?
Support and resistance are the most fundamental concepts of technical analysis. A support is a price level where demand has historically exceeded supply, causing price to bounce. A resistance is a level where supply exceeds demand, blocking the rise. These levels work because they're self-fulfilling: millions of traders look at the same levels and react the same way.
How do you trade Support & Resistance?
Why does the Support & Resistance pattern work?
Support and Resistance are the most fundamental concepts in technical analysis. Support is a price level where buying pressure is strong enough to overcome selling pressure, causing price to stop falling and potentially reverse upward. Resistance is the opposite — a price level where selling pressure overcomes buying pressure, causing price to stop rising and potentially reverse downward.
These levels form because of the collective memory of market participants. A support level often forms at a previous low where buyers previously stepped in — traders remember that level and expect buyers to defend it again. A resistance level often forms at a previous high where sellers previously stepped in — traders remember that level and expect sellers to defend it again. This 'memory' creates self-fulfilling behavior: as price approaches a support, buyers place orders; as price approaches a resistance, sellers place orders.
The strength of a support or resistance depends on: (1) the number of times it has been tested (more tests = stronger), (2) the time span over which it has been valid (longer = stronger), (3) the volume at the level (higher volume = stronger), (4) the timeframe (higher timeframes = stronger). A support tested 5 times over 6 months on the Daily chart is far more significant than one tested twice in a week on the 1H chart.
A key principle is 'role reversal': when a support is broken, it often becomes a resistance, and vice versa. This happens because the buyers who defended the support are now trapped in losing positions and will sell to break even when price returns to their entry level. Understanding this principle allows traders to anticipate where supply and demand will emerge after a breakout.