Wedge
The Wedge is similar to the Flag but with two converging trendlines (instead of parallel) inclined in the same direction.
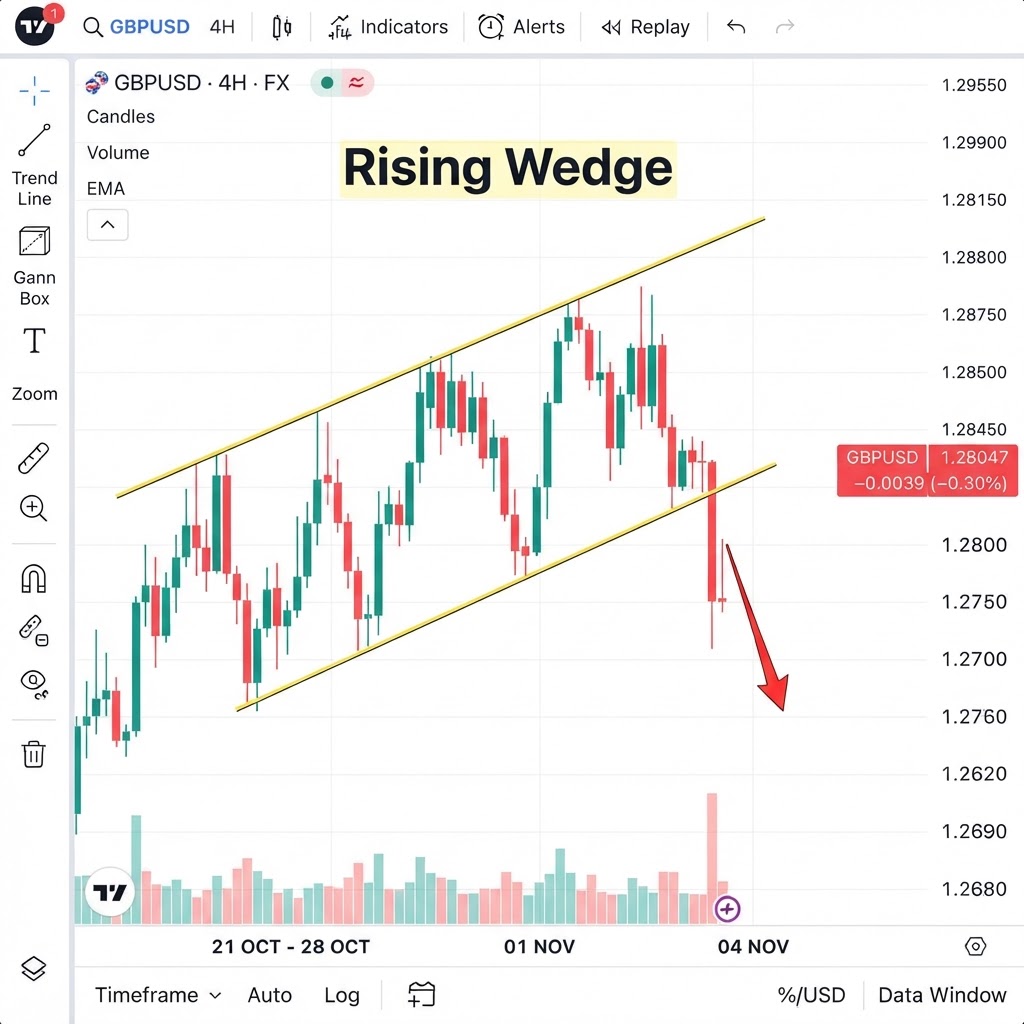
Realistic chart representation
Chart formations require multiple sessions to complete. The higher the timeframe, the more reliable the pattern. Do not anticipate: wait for breakout confirmation.
What is the Wedge pattern?
The Wedge is similar to the Flag but with two converging trendlines (instead of parallel) inclined in the same direction. There are two types: the Rising Wedge which is bearish despite the upward inclination, and the Falling Wedge which is bullish despite the downward inclination. The key is that both trendlines point in the same direction but converge, compressing price.
How do you trade Wedge?
Why does the Wedge pattern work?
The Wedge is a continuation or reversal pattern characterized by two converging trendlines that slope in the same direction. There are two types: the Rising Wedge (bearish) and the Falling Wedge (bullish). Unlike triangles, both trendlines slope in the same direction, creating a wedge shape.
The Rising Wedge forms during an uptrend and is bearish. Both the resistance and support lines slope upward, but the support line rises more steeply, causing convergence. The pattern shows that while price is making higher highs and higher lows, the lows are rising faster than the highs — the momentum is decelerating. This is a warning that the uptrend is losing steam, and a bearish reversal is likely.
The Falling Wedge forms during a downtrend and is bullish. Both trendlines slope downward, but the resistance falls more steeply, causing convergence. The pattern shows that while price is making lower highs and lower lows, the highs are falling faster than the lows — the bearish momentum is decelerating. This is a warning that the downtrend is losing steam, and a bullish reversal is likely.
The breakout direction is typically opposite to the wedge's slope: a Rising Wedge breaks down, a Falling Wedge breaks up. The breakout should occur with above-average volume for confirmation. The projected target is the height of the wedge at its widest point (the base), measured from the breakout point in the breakout direction. Stop loss goes just outside the opposite trendline from the breakout.
Wedges typically form over 3-6 weeks and are more reliable on Daily and Weekly timeframes. The key insight is that the wedge shows momentum deceleration — the trend is still moving in its direction, but with decreasing force. This is an early warning that a reversal is coming.