Ascending Triangle
The Ascending Triangle is a bullish continuation pattern.
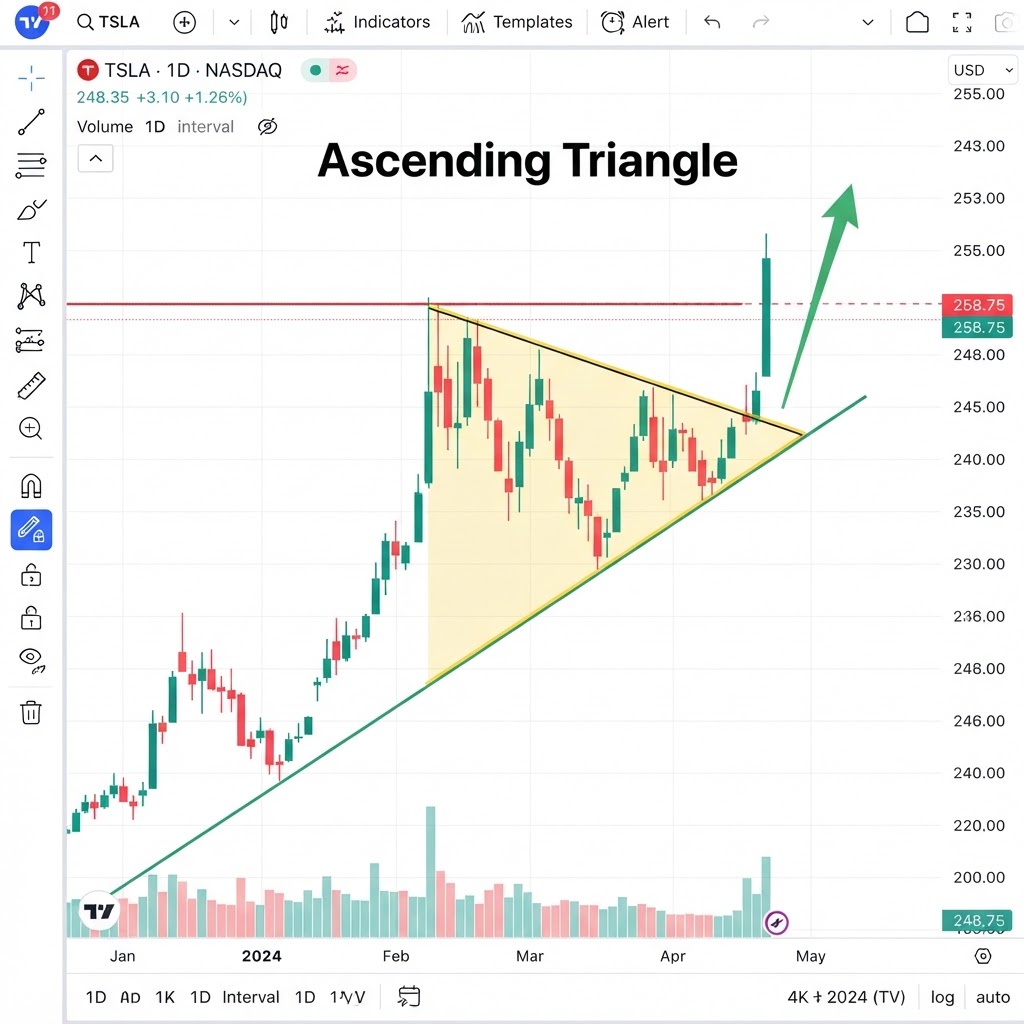
Realistic chart representation
Chart formations require multiple sessions to complete. The higher the timeframe, the more reliable the pattern. Do not anticipate: wait for breakout confirmation.
What is the Ascending Triangle pattern?
The Ascending Triangle is a bullish continuation pattern. It's characterized by a flat (horizontal) resistance at the top and a support trendline with ascending lows. Buyers are progressively pushing lows higher, while repeatedly hitting the same resistance. It typically resolves in a bullish breakout above the flat resistance.
How do you trade Ascending Triangle?
Why does the Ascending Triangle pattern work?
The Ascending Triangle is a bullish continuation pattern that typically forms during an uptrend. It consists of a horizontal resistance line (flat top) and an ascending support line (rising lows). Price makes multiple tests of the resistance at the same level while the lows get progressively higher, creating a right-angle triangle shape.
The pattern's psychology is clear: buyers are becoming increasingly aggressive. Each pullback is shallower than the previous one, showing that buyers are stepping in earlier and at higher prices. The flat resistance shows that sellers are defending a specific level, but the rising lows show that their defense is weakening with each test. Eventually, the buying pressure overcomes the selling, and the resistance breaks.
The breakout should occur with above-average volume — this is the critical confirmation. A low-volume breakout is suspect and may be a false breakout. The projected target is the height of the triangle (distance from the flat resistance to the lowest point of the ascending support), measured upward from the breakout point. Stop loss goes just below the ascending support line.
The Ascending Triangle is more reliable when: (1) the horizontal resistance has been tested at least 3 times, (2) the ascending support has at least 2-3 higher lows, (3) the pattern forms during an established uptrend, (4) the breakout has strong volume. False breakouts are common with this pattern — always wait for the candle to close above the resistance before entering.