Fibonacci in Charts
Fibonacci Retracement applied to chart analysis is a tool to identify support/resistance zones during price corrections.
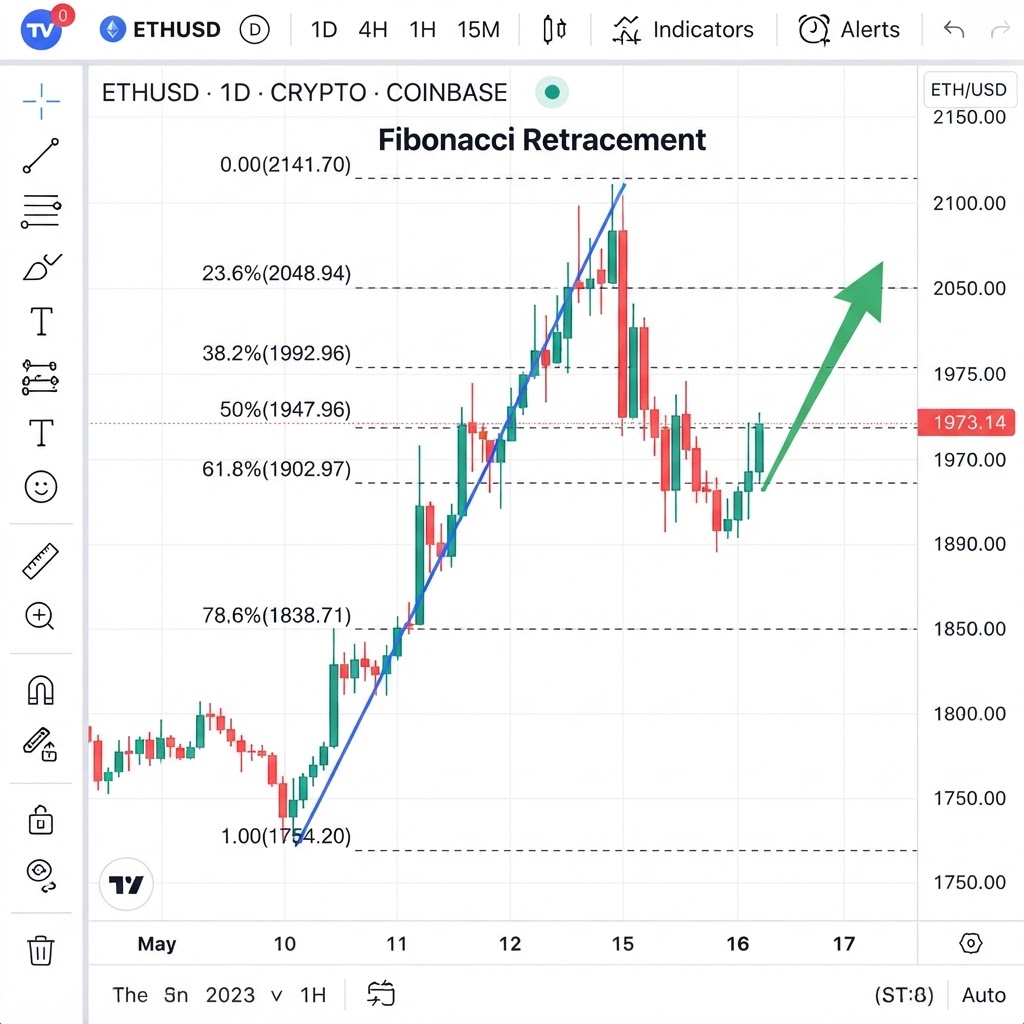
Realistic chart representation
These concepts are the foundation of all technical analysis. Mastering them is a prerequisite for any professional trading strategy.
What is the Fibonacci in Charts pattern?
Fibonacci Retracement applied to chart analysis is a tool to identify support/resistance zones during price corrections. The key levels (23.6%, 38.2%, 50%, 61.8%, 78.6%) represent points where price tends to find support or resistance before resuming the main trend. The 61.8% (Golden Ratio) is the most respected level.
How do you trade Fibonacci in Charts?
Why does the Fibonacci in Charts pattern work?
Fibonacci retracements are based on the Fibonacci sequence, a mathematical series where each number is the sum of the two preceding ones (0, 1, 1, 2, 3, 5, 8, 13, 21, 34, 55, 89, ...). The key ratios derived from this sequence — 23.6%, 38.2%, 50%, 61.8%, 78.6% — are used in technical analysis to identify potential support and resistance levels during a retracement.
The 61.8% ratio (the 'golden ratio') is the most important. It's derived by dividing any number in the sequence by the next number (e.g., 55/89 = 0.618). This ratio appears throughout nature, art, and architecture, and many traders believe it has special significance in financial markets. The 50% level, while not a true Fibonacci ratio, is included because of its psychological importance and historical reliability.
To use Fibonacci retracements, a trader identifies a significant move (swing low to swing high for an uptrend, or swing high to swing low for a downtrend) and draws the Fibonacci levels from the start to the end of the move. The retracement levels then act as potential support (in an uptrend) or resistance (in a downtrend) when price pulls back. The 38.2% and 61.8% levels are the most watched — a retracement to 38.2% is a shallow pullback (strong trend), while a retracement to 61.8% is a deep pullback (weaker trend but higher-probability bounce).
Fibonacci extensions (1.272, 1.618, 2.618) are used to project targets beyond the original move. The 1.618 extension is the most common target. Fibonacci confluence — when a Fibonacci level aligns with a horizontal support, a trendline, or a moving average — creates high-probability zones. The key is not to use Fibonacci in isolation but to combine it with other tools for confluence.