StrategiesMACD Divergence
🔀 DivergenceAdvanced
MACD Divergence
MACD is one of the most effective momentum indicators for divergences. Combined with key price levels, it produces high-quality reversal setups on any market.
ForexStocksCrypto
Typical R/R
1:2 — 1:4
Win Rate
50–58%
Timeframe
4H, Daily
Category
Divergence
[ STRATEGY SCHEMA ]
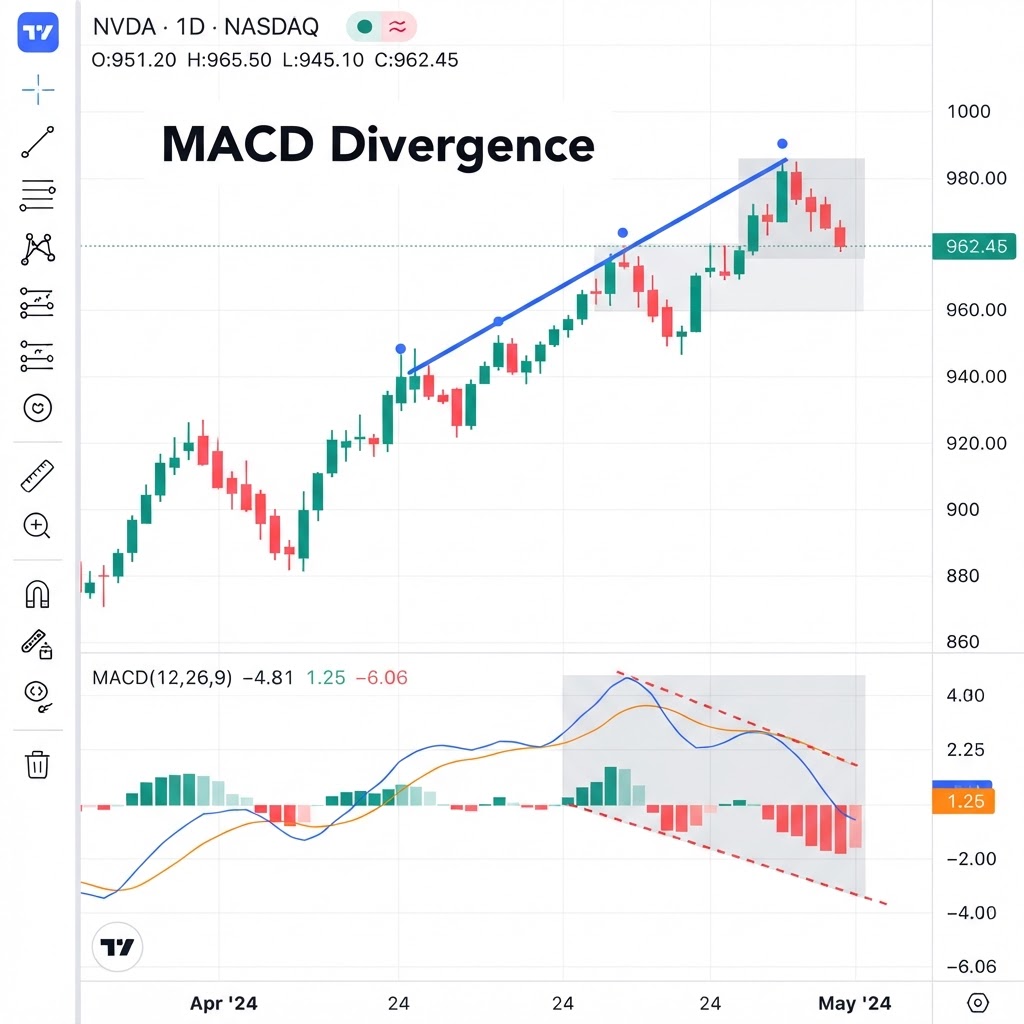
[ MARKET LOGIC ]
MACD measures the distance between two moving averages (12 and 26 period EMAs). When price rises to new highs but MACD makes lower highs, the distance between the two EMAs is shrinking — momentum is declining. The MACD histogram is even more sensitive and shows this divergence earlier than the MACD line itself.
PROS
MACD is a lagging indicator but excellent for divergences
The histogram shows divergences before the MACD line
High reliability on Daily and Weekly
CONS
Slow on low timeframes
Requires practice to distinguish real divergences from noise
What are the setup conditions for MACD Divergence?
→
BEARISH: Price HH (Higher High) + MACD/Histogram LH (Lower High) at resistance→
BULLISH: Price LL (Lower Low) + MACD/Histogram HL (Higher Low) at support1
Draw the divergence on the MACD histogram (more sensitive than the MACD line)2
The second peak/trough of MACD must be significantly lower/higher3
Confirmation candle at the price zone4
Optional confirmation: RSI shows the same divergenceWhich filters improve the quality of the signal?
Use only on 4H or higher timeframes for reliable divergences
The histogram divergence must be on clear peaks, not on noise
Look for confluence with RSI showing the same divergence
[ RELATED STRATEGIES ]
[ RELATED CONTENT ]